- March 29, 2026
- Posted by: admin
- Category: BitCoin, Blockchain, Cryptocurrency, Investments

![Bitcoin Price Today [LIVE] Updates, Why is Crypto Going Up 16th March](https://image.coinpedia.org/wp-content/uploads/2026/03/16140330/Bitcoin-Price-Today-LIVE-Updates-Why-is-Crypto-Going-Up-16th-March-1024x536.webp)
The post $12B Shorts vs $3B Longs—Is Bitcoin Price Set for a Short Squeeze Rally? appeared first on Coinpedia Fintech News
Bitcoin price continues to trade within a tight range near $66,700, showing limited momentum despite a slight 0.57% gain over the past 24 hours. While the broader crypto market remains relatively flat, BTC is holding key support levels, hinting at underlying demand. Beneath this muted price action, however, a high-stakes setup is quietly building. Recent liquidation data points to a significant imbalance in the market, suggesting that the next move may be driven less by sentiment and more by liquidity positioning.
As a result, Bitcoin’s next directional move is likely to depend on where the largest clusters of leveraged positions are concentrated—making this a classic liquidity-driven setup rather than a momentum-led breakout.
Bitcoin Liquidation Map: Where the Real Pressure Lies
The latest liquidation data reveals a significant imbalance in the derivatives market. Over $12 billion worth of short positions are stacked above Bitcoin’s current price, while only around $3 billion in long liquidations sit below. This uneven distribution highlights a key dynamic: liquidity is heavily concentrated on the upside as more pressure is building above the current price range.
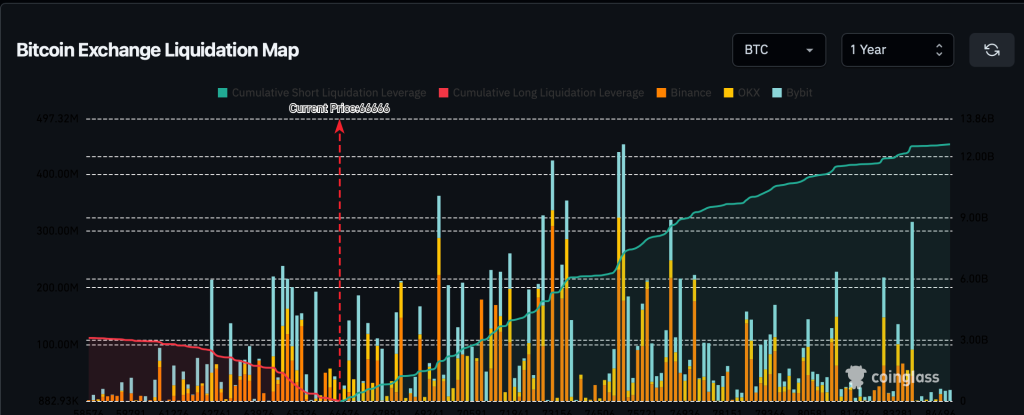
The BTC price appears more likely to move higher in the short term, targeting these short positions, which may further trigger a short squeeze. Although this does not confirm a sustained bullish trend, these liquidity-driven moves are temporary, followed by sharp reversals once the positions are cleared. This suggests that the price may follow a strong upside, but the traders need to remain cautious about a potential pullback after the liquidity is absorbed.
Bitcoin Price Analysis: BTC Struggles Below Key Resistance
Bitcoin is currently trading around the $66,600 level, continuing to move within a tight range after facing repeated rejections near the $70,000–$72,000 zone. The 4-hour chart reflects a lack of strong directional momentum, with price action leaning slightly bearish in the short term. A closer look at the Bollinger Bands shows that BTC is trading below the mid-band, indicating that buyers are struggling to regain control.
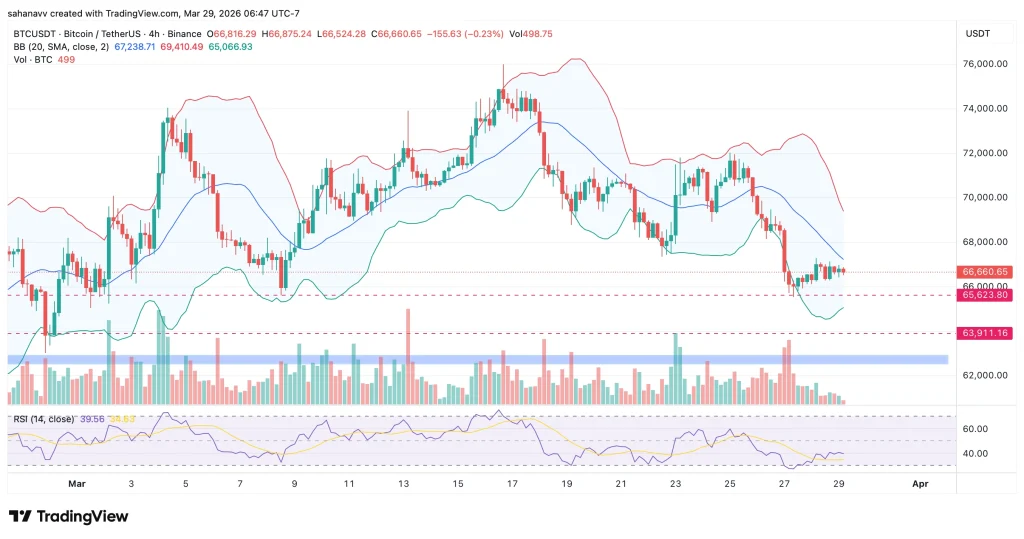
Although the price recently bounced from the lower Bollinger Band near $65,000, the recovery remains weak, suggesting that the move may be a temporary relief rather than a confirmed reversal. The Relative Strength Index (RSI) is hovering near the 40 level, reflecting neutral-to-bearish momentum. This indicates that while the market is not oversold, it also lacks the strength required for a sustained upside move.
Key Levels to Watch
- Immediate Resistance: $68,000
- Major Resistance: $70,000–$72,000
- Immediate Support: $65,600
- Strong Support: $63,900
Wrapping it Up: Liquidity Signals Strength, But Bitcoin Price Needs Confirmation
Bitcoin is currently caught between bullish liquidity signals and weak price structure, creating a high-risk, high-opportunity setup. In the near term, Bitcoin could see a short squeeze toward the $68,000–$70,000 range, driven by liquidity. However, unless BTC manages to sustain above these levels, the move may turn into a bull trap, followed by renewed downside pressure. On the flip side, a breakdown below $65,600 could expose the next key support at $63,900, where buyers are expected to step in.


