- October 11, 2024
- Posted by: admin
- Category: BitCoin, Blockchain, Cryptocurrency, Investments
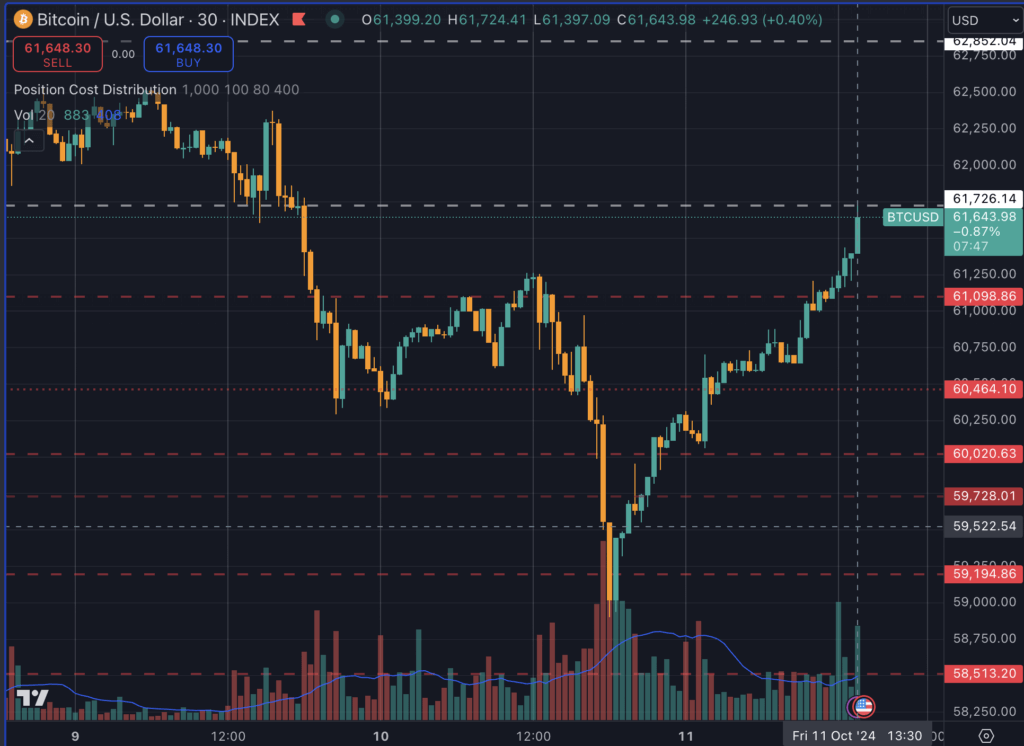
Bitcoin briefly fell below $59,000 last night before rebounding to reclaim the critical $61,000 level in a rapid V-shaped recovery. Historical data indicates that similar swift recoveries on a 30-minute resolution have consistently led to either higher gains or sideways trading, with few instances of further declines.
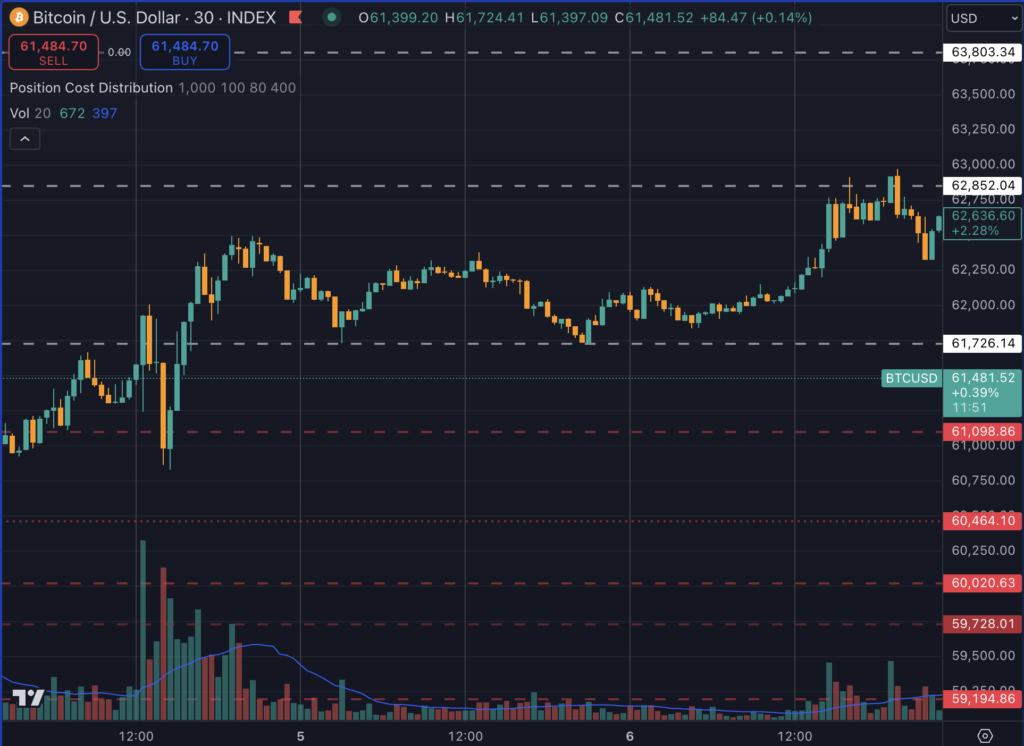
Last week, Bitcoin dropped from $62,000 to around $61,000 before quickly rebounding and trading above $61,000 for several days, eventually reaching $62,800.
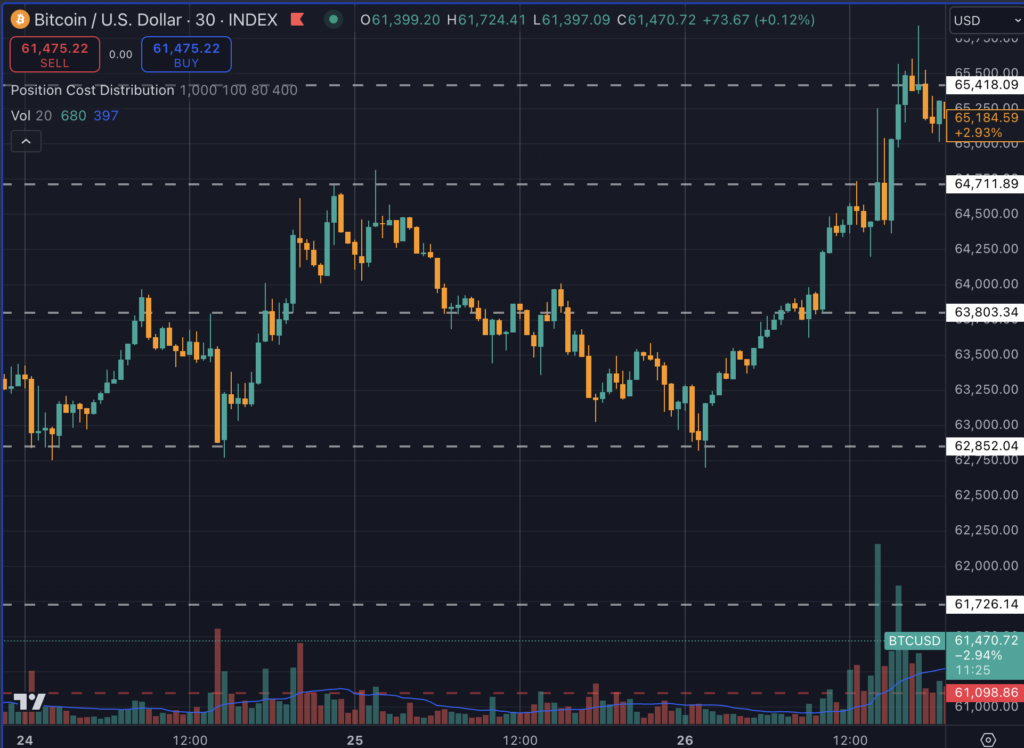
In late September, after a similar drop to $63,800, Bitcoin formed a V-shaped recovery, surging to $65,400.
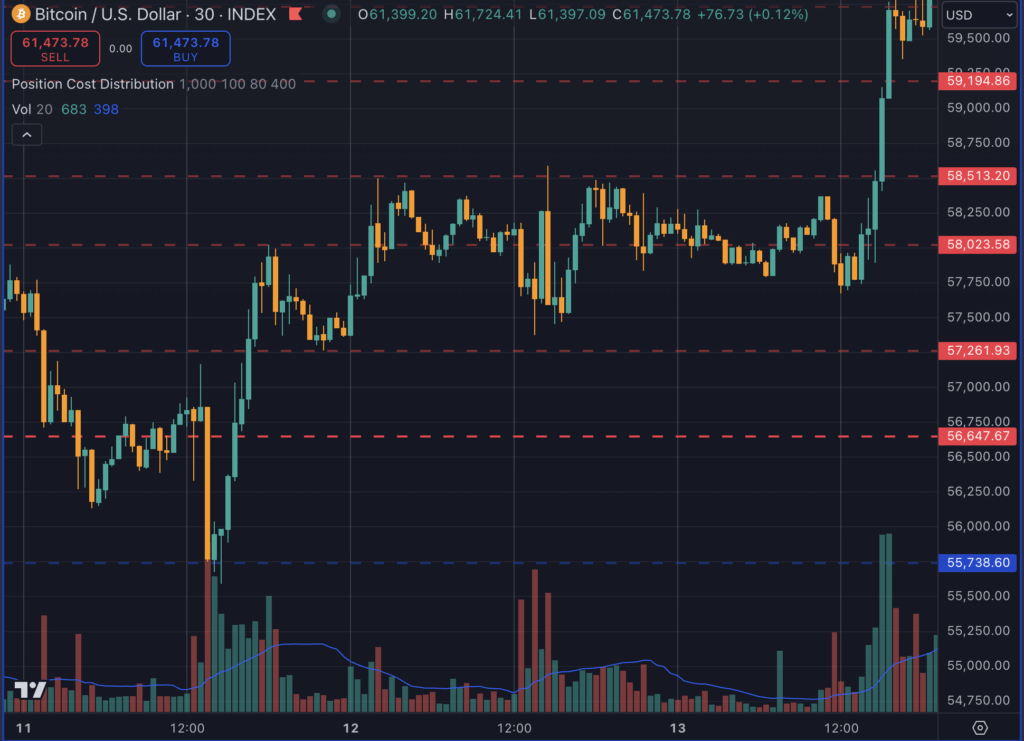
Earlier that month, on Sept. 11, Bitcoin fell from $56,600 to $55,700, only to recover within two hours and regain its position near $60,000 over the following two days.
This pattern can also be traced back to August, when Bitcoin experienced a significant drop from $52,800 to $49,700 on Aug. 5. A V-shaped recovery that afternoon pushed it back to $54,000, with momentum continuing over the next two days, driving the price up to $58,000.
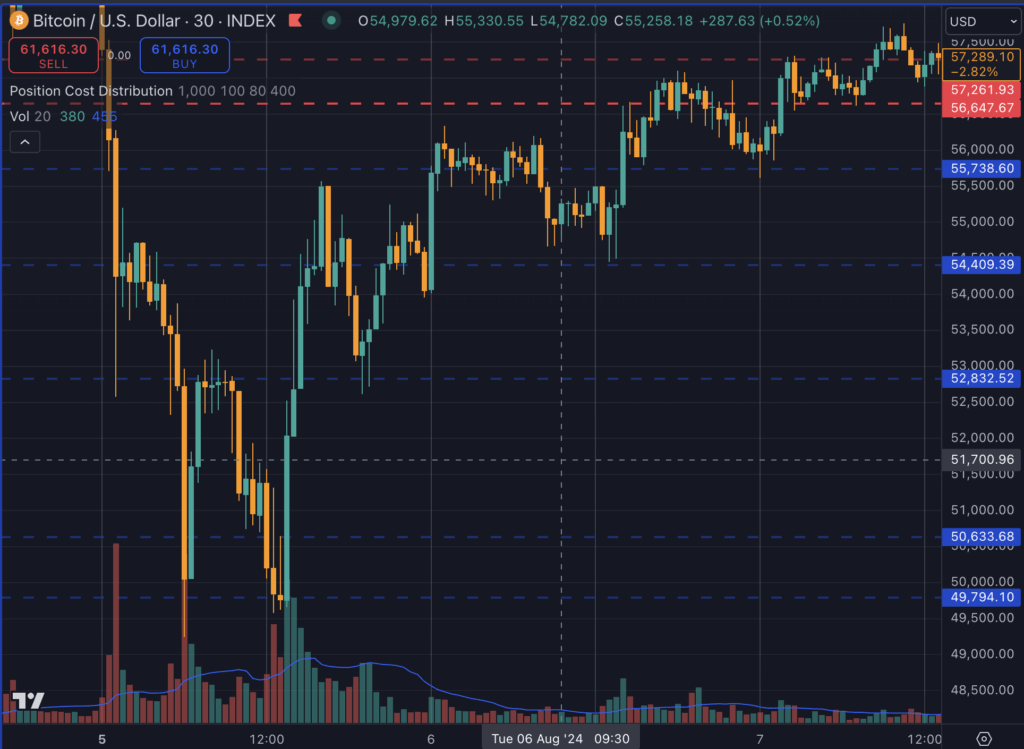
Today’s dip below $59,000, followed by a potential retest of the $61,700 resistance level, suggests Bitcoin is once again following this familiar pattern of rapid recovery and upward movement, reinforcing the significance of these sharp rebounds in signaling future price action.
While past performance is not indicative of future outcomes, the recurring nature of these recoveries signals potential stability or bullish momentum following such sharp dips. Monitoring Bitcoin’s behavior within this timeframe may provide insights into potential market movements in the coming days.
This pattern has been observed since at least June of this year, suggesting that the 30-minute resolution is a key indicator for assessing Bitcoin’s short-term market moves, especially after the launch of Bitcoin spot ETFs.
This data reinforces the idea that investors should remain attentive to short-term patterns, particularly on lower timeframes, to gauge Bitcoin’s near-term trajectory.
The post V-shaped recoveries historically bullish for Bitcoin as market rapidly retakes $61,000 appeared first on CryptoSlate.


