- October 28, 2024
- Posted by: admin
- Category: BitCoin, Blockchain, Cryptocurrency, Investments


The post Here’s Why Bitcoin is not returning to $65k in 2024! appeared first on Coinpedia Fintech News
Over the last volatile week in the crypto market, the Bitcoin price resonated between the $69,000 and $65,000 mark. Currently, the Bitcoin price is trading at $68,217 with an intraday gain of 0.41%.
With a bullish turnaround, will the BTC price record a swing high above the $70,000 threshold this week? Check out our Bitcoin price analysis to find out now!
Bitcoin (BTC) Price Analysis
The minor recovery in Bitcoin (BTC) price marks a positive start to this week and continues the bullish momentum gained over the weekend. Following the massive drop of 2.31% on Friday, Bitcoin rose by 0.64% and 1.40% on Saturday and Sunday, respectively.
The Bitcoin recovery rally is gaining momentum and has sustained dominance over the $68,000 mark. In the daily chart, the minor pullback before the weekend counts as a retest of the resistance trendline breakout.
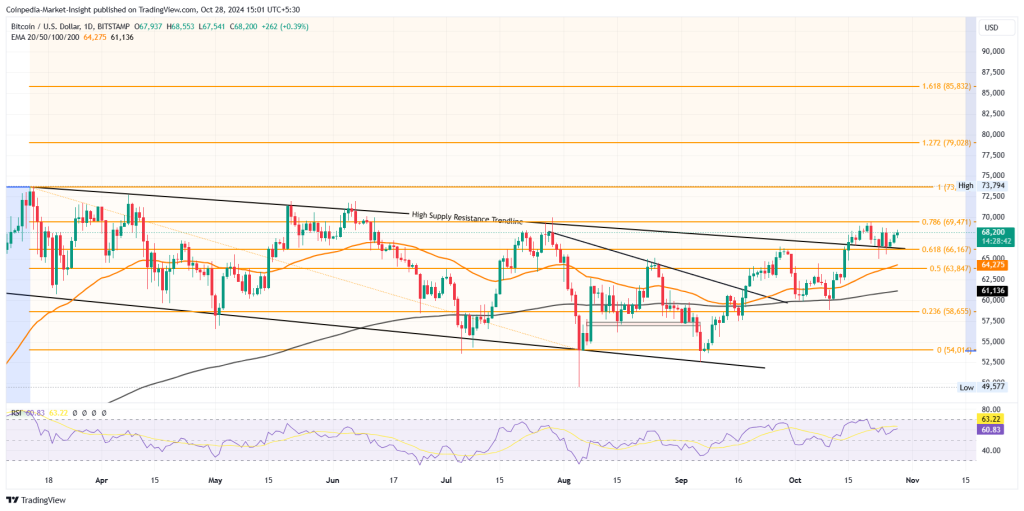
Based on the Fibonacci level, the reversal started at 78.60% Fibonacci and took support at 61.80% Fibonacci level at $66,167. The bullish reversal is ready to challenge the 78.60% level as the BTC price recovers. Meanwhile, the growing bullish influence increases the possibility of an uptrend continuation.
Double Bottom Reversal in BTC Price
In the 4-hour chart, the BTC price action reveals a double-bottom reversal with massive divergence in the RSI line, teasing a bullish comeback. Currently, the BTC price is retesting the neckline at $68,200 as it has given up takeouts without bullish engulfing candles.
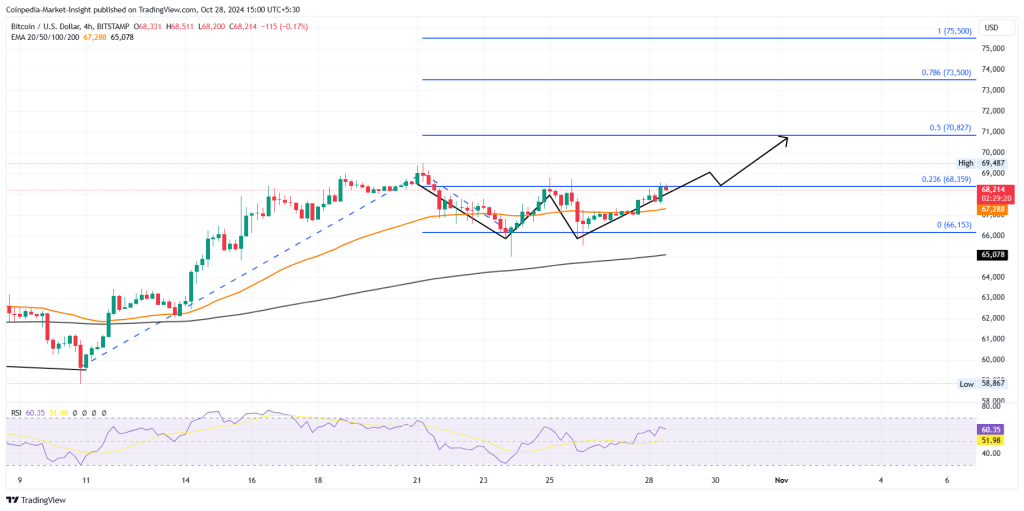
Based on the trend-based Fibonacci level, the uptrend is yet to surpass the 23.60% level at $68,359 in the 4-hour chart. A bullish breakout will likely surpass the $70,000 mark to reach the 60% Fibonacci level at $70,817.
With the recovery rally gaining momentum, the short-term upside targets are the 78.60% and 100% Fibonacci levels at $73,500 and $75,500.
Bitcoin ETFs Witness ~$3.5B Net Inflow in 3 Weeks
As the bullish trend in Bitcoin gradually gains momentum, institutional support continues to grow. Over the last three weeks, the US spot Bitcoin ETFs have registered a net inflow each week.
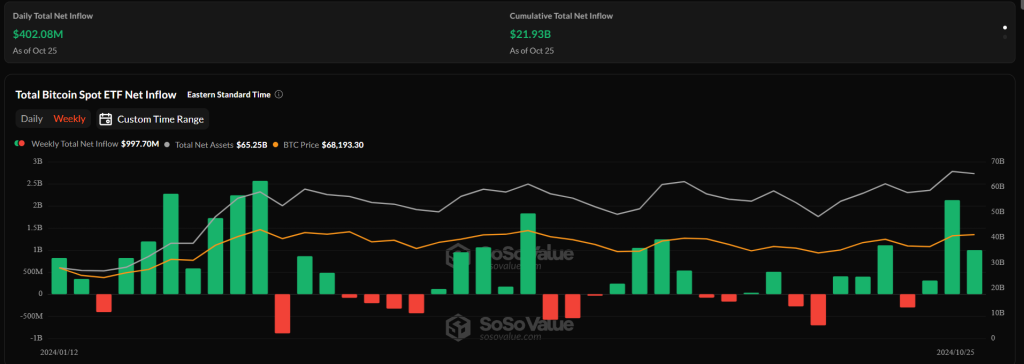
In the last three weeks, the net inflow accounts for ~$3.5B and is likely to continue the trend this week. IBIT currently holds $26.98 billion worth of BTC tokens and remains the biggest U.S. spot Bitcoin ETF. Hence, the rising support from institutions will likely fuel the next bull run in Bitcoin (BTC) prices.
Curious to know if Bitcoin will hit $100k in 2024? Find a technically and logically driven answer in Coinpedia’s BTC price prediction for 2024 to 2030!


