- November 29, 2023
- Posted by: admin
- Category: BitCoin, Blockchain, Cryptocurrency, Investments
Most crypto trading volume has historically come from outside the U.S., with Asia being the largest cryptocurrency market. However, there has been a notable shift in this dynamic in the past several months, with the U.S. returning to its position as the dominant force in the Bitcoin market.
This shift is evident when analyzing Bitcoin’s price and supply distribution changes across Asia and the U.S.
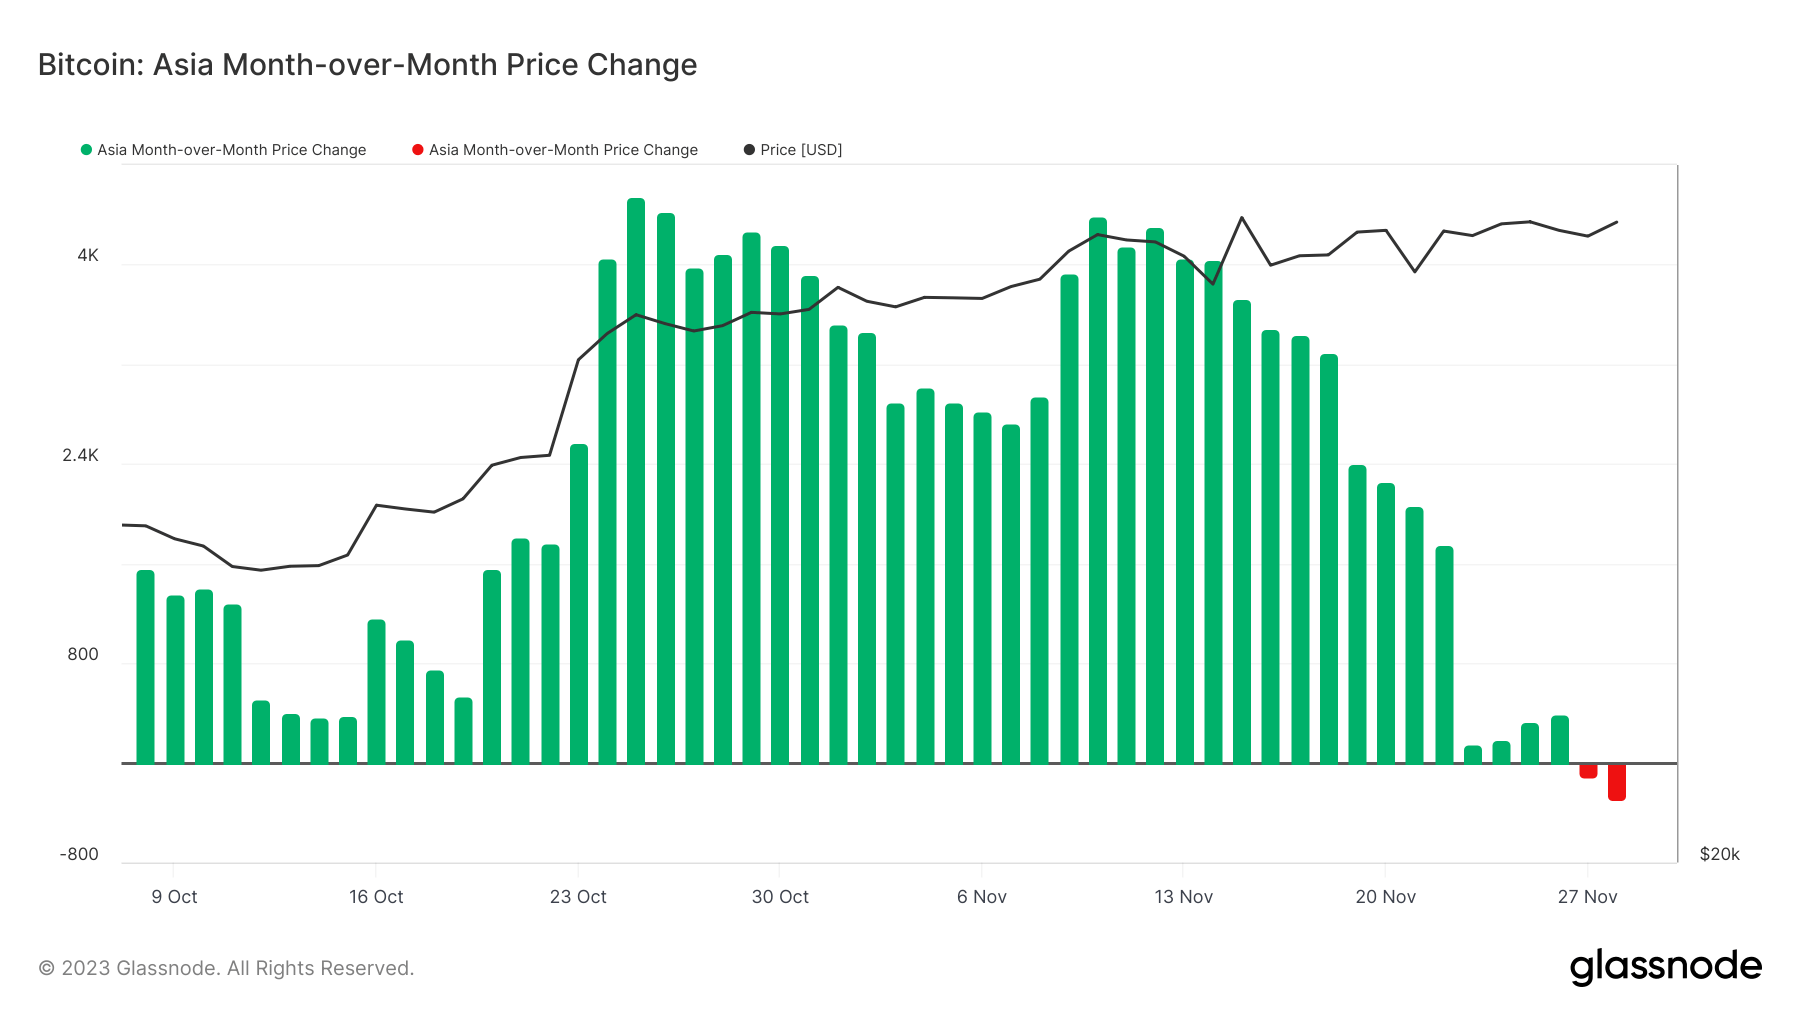
Looking at the month-over-month price change of Bitcoin during Asian working hours shows the regional fluctuations in Bitcoin’s price, reflecting the market’s response to various economic and political stimuli specific to Asia. The trends observed here indicate the level of market activity and investor sentiment within the region, offering a glimpse into the regional influence on Bitcoin’s global pricing.
Data from Glassnode has shown a sharp decrease in the 30-day change in Bitcoin’s price set during Asian working hours in November.

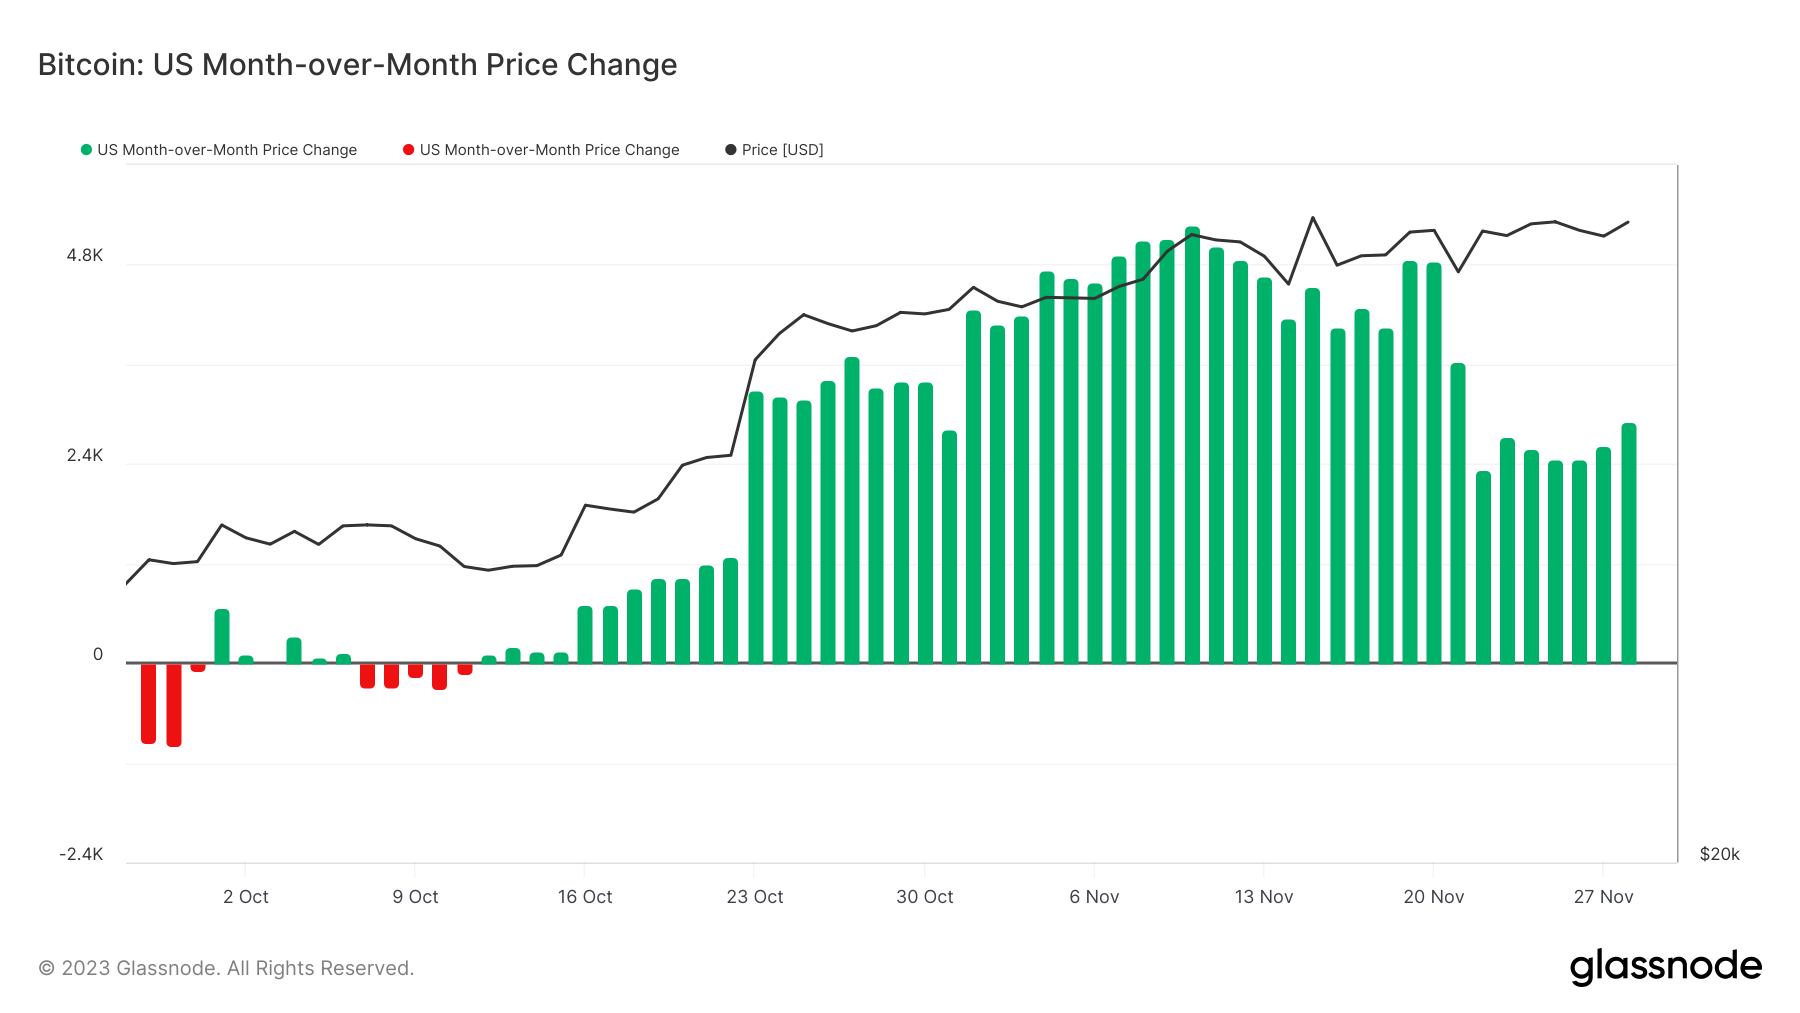
The month-over-month price change during U.S. working hours contrasts with the Asian market data, revealing a different market behavior and investor attitude. The U.S. market shows a significant influence over Bitcoin’s price despite variations in trading volumes and market participation compared to its Asian counterpart.

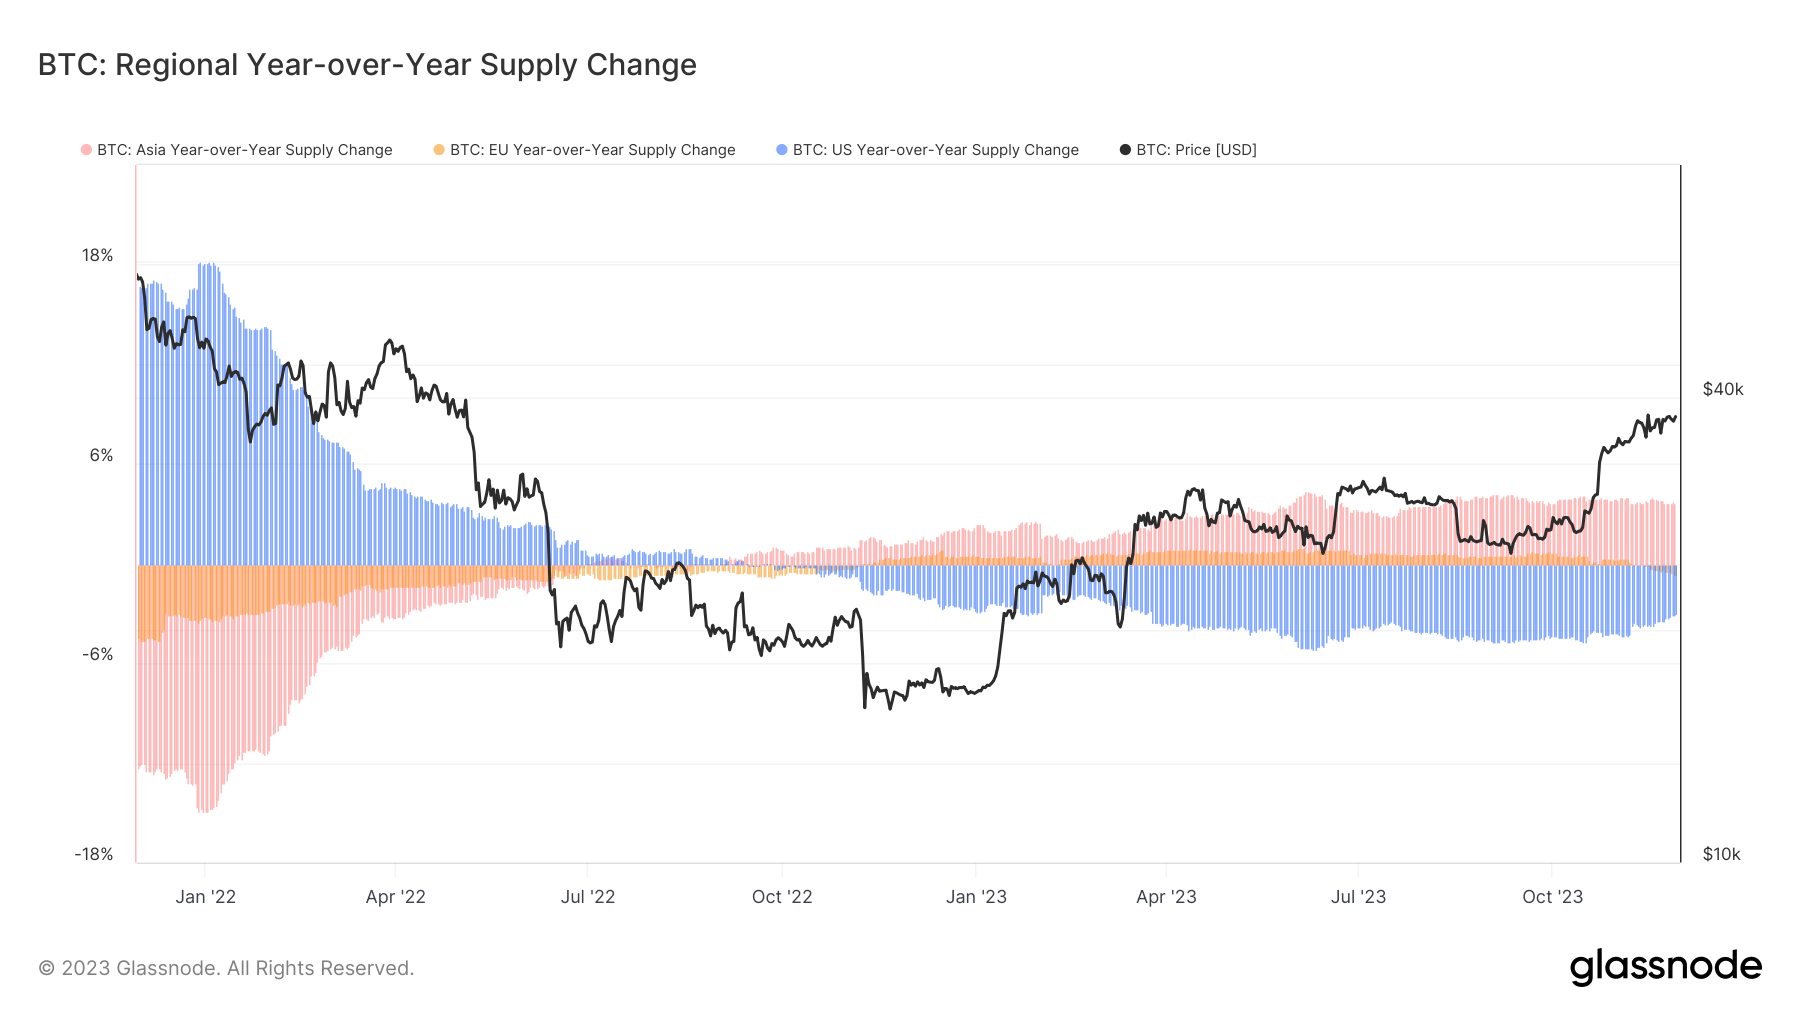
The year-over-year change in Bitcoin’s supply across different regions is crucial in understanding the shifts in regional dominance or decline concerning Bitcoin holdings. A key observation from this dataset is the trend in U.S. holdings, which have been decreasing since September 2022. In contrast, the supply held by investors in Asia has been increasing, recording a 3.7% year-over-year growth as of Nov. 28.

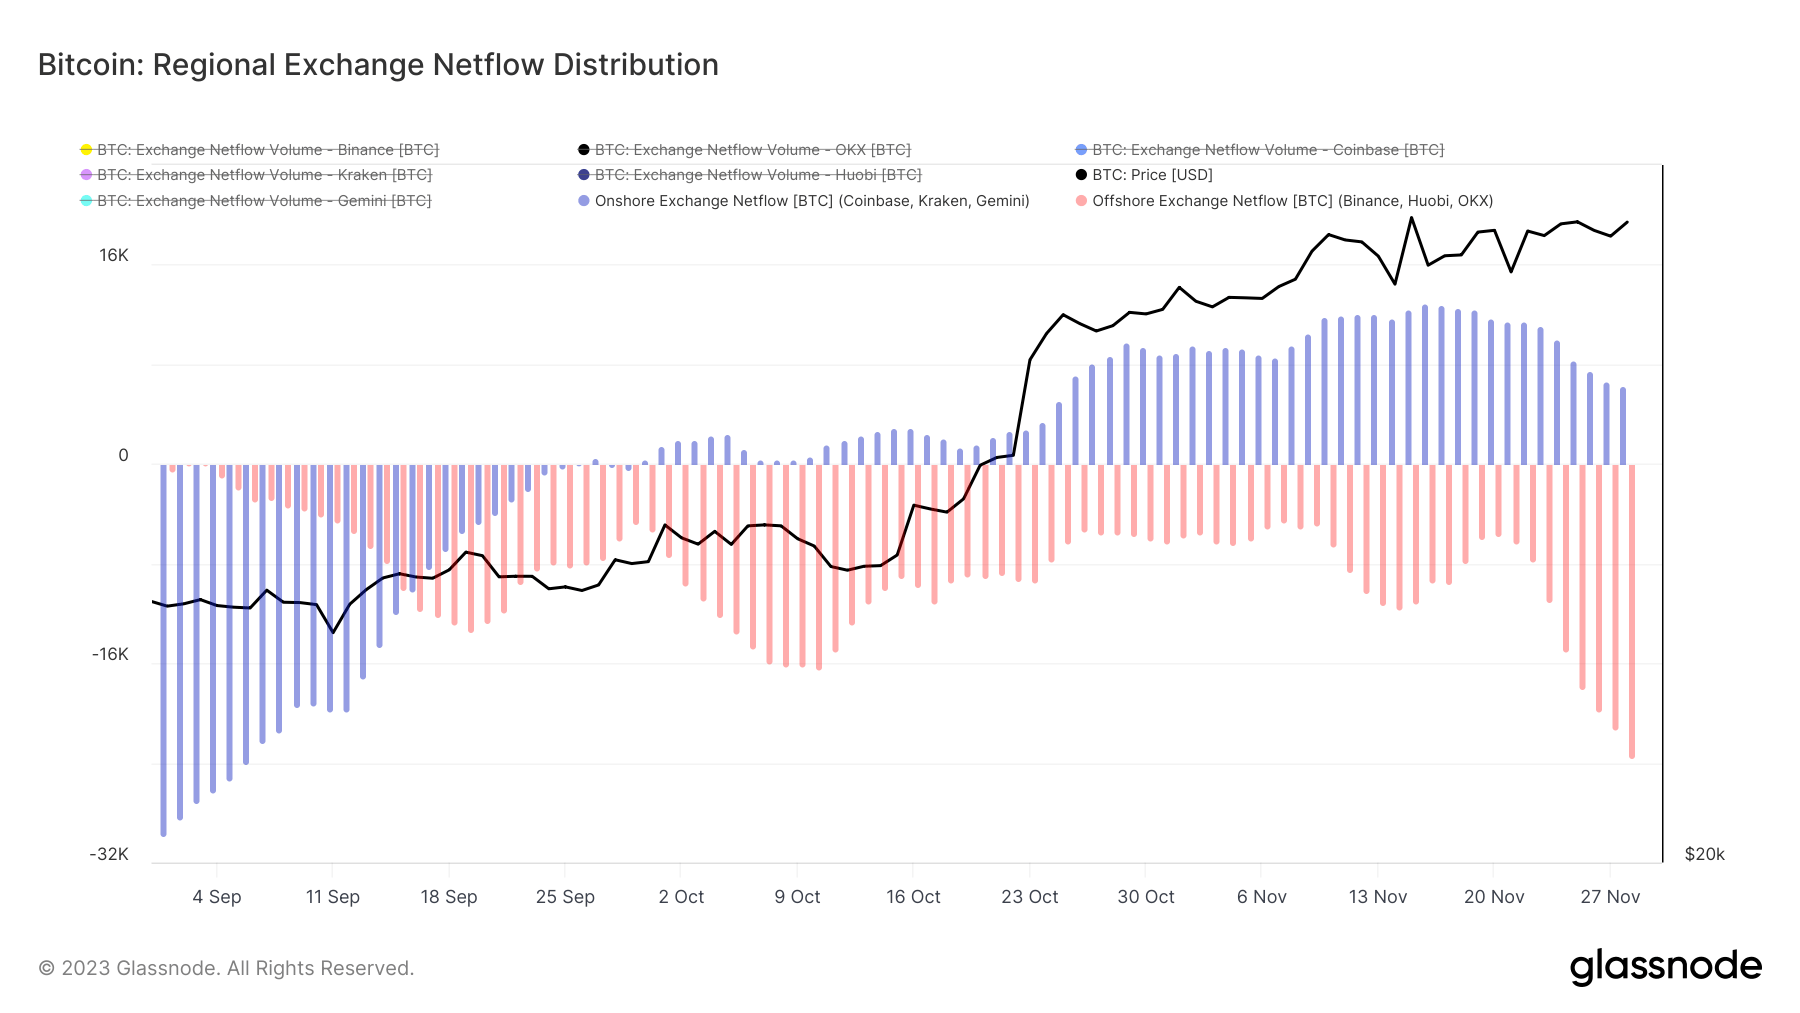
Moreover, the net flow of Bitcoin into and out of exchanges, both in the U.S. and offshore, is a strong indicator of investor sentiment and market activity. For instance, a net inflow might suggest a bullish market sentiment, with investors buying or holding Bitcoin. In contrast, a net outflow could indicate bearish sentiment, with selling or a lack of confidence prevailing.
In the past two months, U.S. exchanges Coinbase, Kraken, and Gemini have seen their inflows increase drastically. Offshore exchanges Binance, Huobi, and OKX have all registered net outflows since the beginning of September.

Despite a decrease in the year-over-year supply of Bitcoin in the U.S., the country’s influence over Bitcoin’s price remains pronounced. This phenomenon suggests that the remaining Bitcoin supply in the U.S. is potentially controlled by influential market players or institutions capable of significantly impacting market prices. This paradoxical trend underscores the U.S. market’s critical role in the Bitcoin ecosystem. The decreasing supply could be attributed to various factors, including regulatory environments and strategic investment decisions. Concurrently, the increasing price influence points to a market where decision-making and market power are concentrated among a limited number of U.S.-based investors or institutions.
The post U.S. reclaims dominance in Bitcoin market despite supply shift appeared first on CryptoSlate.
