- July 3, 2024
- Posted by: admin
- Category: BitCoin, Blockchain, Cryptocurrency, Investments
Quick Take
Bitcoin (BTC) has often mirrored the S&P 500 (SPX), with periods of positive correlation in the past five years, notably during the COVID-19 pandemic in 2020 and 2021, where both assets traded nearly 1:1. This trend continued towards the end of 2021 and throughout 2022, as both BTC and the SPX declined in tandem. In the first quarter of 2024, both Bitcoin BTC and SPX experienced significant gains.
While the SPX continues to reach new all-time highs, surpassing 5,514, BTC has struggled around the $60,000 mark, occasionally dipping below this threshold. This divergence is reflected in their correlation, which has dropped to a mere 0.05 over a 20-day moving average.
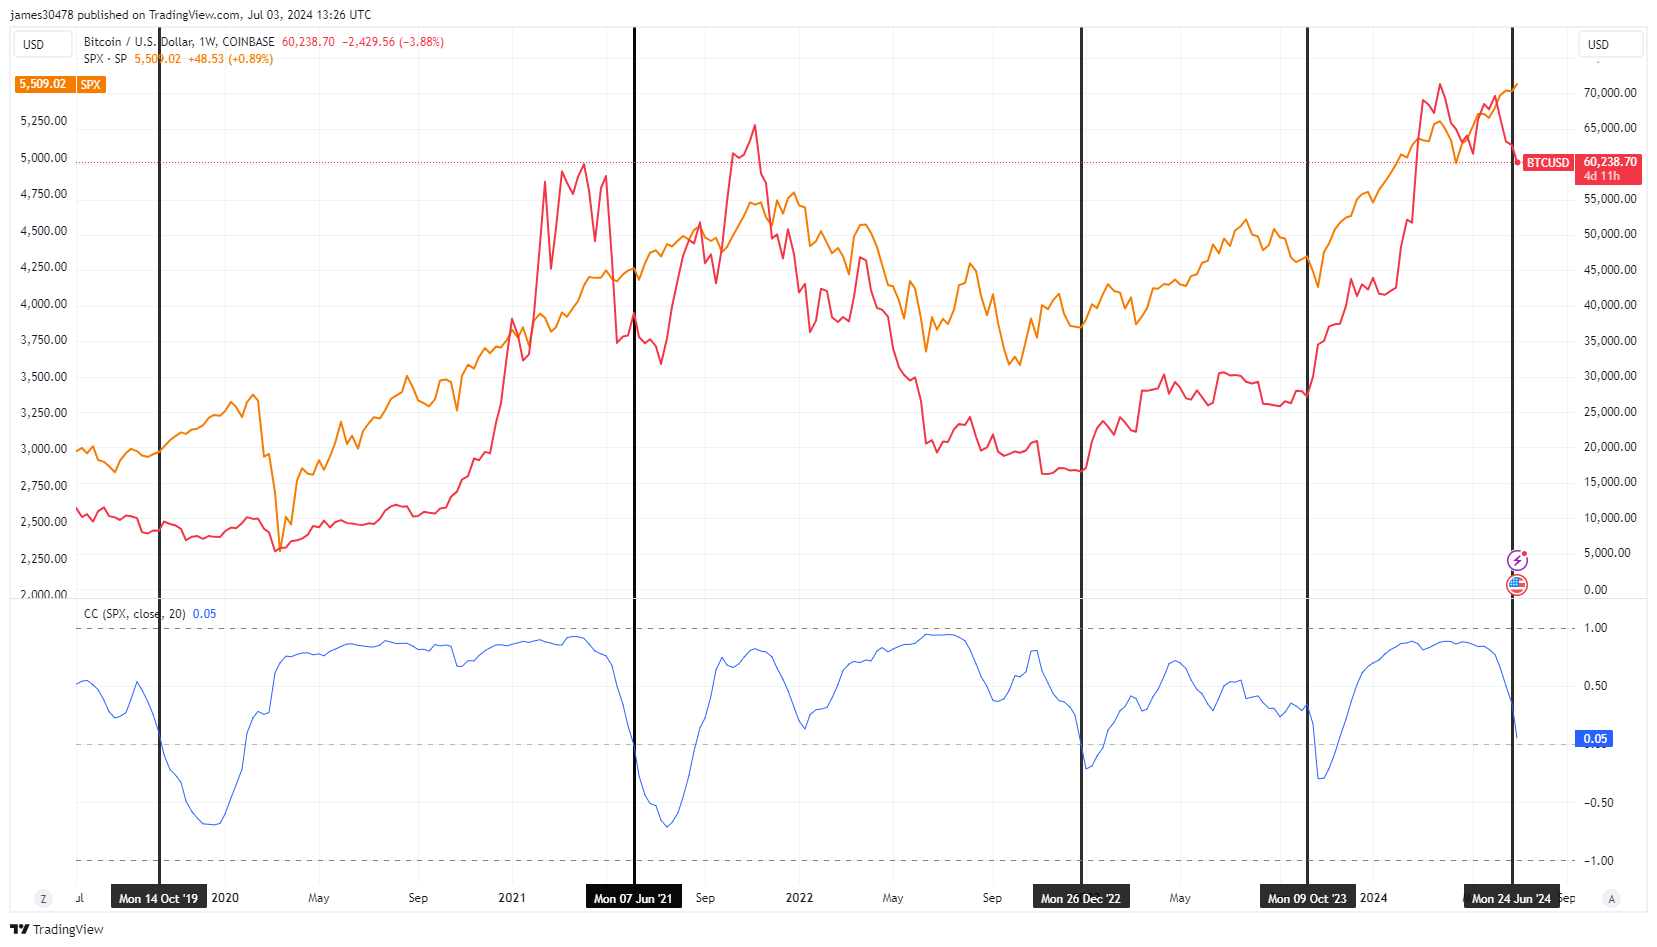
Since 2019, BTC and SPX have experienced negative correlations four times: October 2019, during a Bitcoin bear market; June 2021, amid the China mining ban, which saw BTC fall to around $30,000; December 2022, following the FTX collapse, which marked a cycle low; and October 2023, when BTC was consolidating before a substantial rally from approximately $25,000 to over $70,000 within six months.
It appears that when BTC and SPX exhibit negative correlation and significant divergence, it often signals a local low in Bitcoin’s price action.
The post Bitcoin correlation to S&P 500 goes negative indicating potential bottom appeared first on CryptoSlate.


