- September 20, 2024
- Posted by: admin
- Category: BitCoin, Blockchain, Cryptocurrency, Investments
Bitcoin has surged 11% since Tuesday following the Federal Reserve’s announcement of a 50 bps interest rate cut. This significant price movement pushed BTC past the $62,000 mark, a psychological level that shifted investor sentiment toward optimism.
However, despite the recent rally, critical data from Glassnode reveals that both Bitcoin capital inflows and outflows remain relatively small, indicating reduced market activity.
The current state of the Bitcoin market reflects a sense of equilibrium, where the price is stable, but trading volumes are lower than expected. While some investors see this balance as an attractive entry point, anticipating a continued upward trend, others are more cautious. The lack of strong demand could potentially lead to a slowdown or reversal in price momentum if new buyers fail to enter the market.
As Bitcoin hovers around this crucial price level, the next few days will be essential in determining whether the market will continue to surge or face a pullback due to limited liquidity. Investors are closely monitoring the situation to gauge whether this equilibrium will break in favor of further growth or stagnation.
Bitcoin Minimal Profit And Loss-Taking: What Does It Mean?
After days of positive price action and excitement about a potential bull run, Bitcoin still faces risks.
Key data from Glassnode highlights the market’s current state of equilibrium, prompting cautious optimism among investors. The Sell-Side Risk Ratio has dropped below the low-value band, indicating minimal profit-taking or loss-cutting in the current range. This suggests that equilibrium has been reached, with investors hesitant to make moves until there is a broader price expansion.
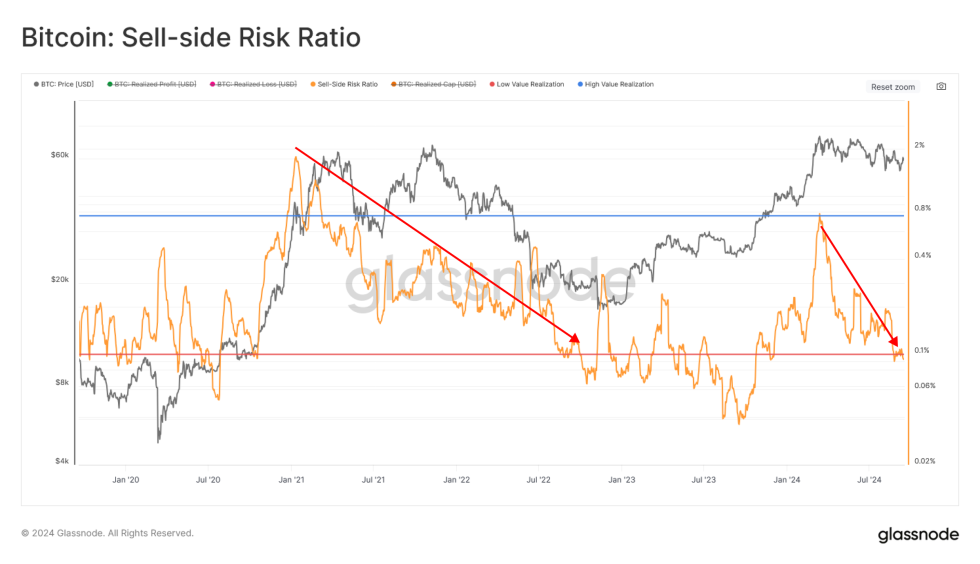
The interpretation here is clear: Bitcoin needs to break out of its range to encourage more significant investor participation. Price action has been oscillating within a well-defined range over the last six months, with volatility compressing like a coiling spring. The tighter this range becomes, the more likely it is to result in a dramatic price movement in either direction.
Recent macro events, including the Federal Reserve’s interest rate cut, may provide the catalyst Bitcoin needs. The 50 bps cut has been viewed as a signal for more liquidity entering the market, which could fuel the anticipated surge in volatility.
Investors are hopeful that this event will break the current price stagnation, setting the stage for Bitcoin’s next significant move. Though the market is in equilibrium now, many believe a major shift is just around the corner.
BTC Breaks Past $62,000 –The Start Of A New Rally?
Bitcoin is trading at $63,493 after an impressive 22% surge from its local lows set on September 6. The price has broken past the daily 200 exponential moving average (EMA) at $59,396 and is now testing the daily 200 moving average (MA) as resistance.
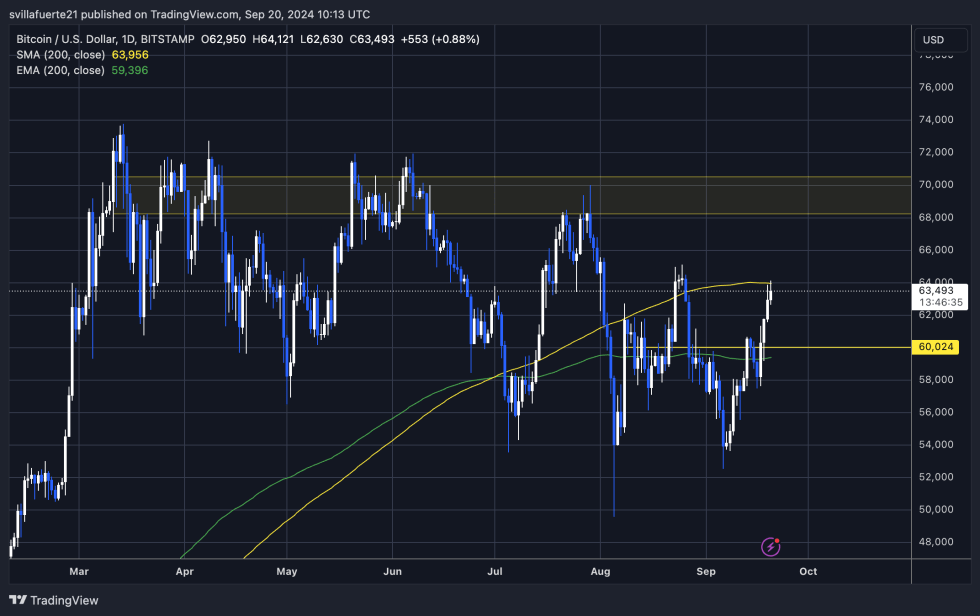
These indicators are historically crucial for Bitcoin, as they often serve as key support and turning points during rallies. Reclaiming the daily 200 MA would signal long-term strength and could confirm the start of a sustained uptrend.
For bulls aiming to push BTC to new highs, breaking past the daily 200 MA and the $65,000 level is essential. Holding these levels as support would solidify a change in market structure, which has been dominated by downward trends over the past six months.
However, if BTC fails to reclaim the 200 MA, a retracement toward lower demand levels around $60,000 is likely. This price level may act as a magnet for testing demand before continuing the upward trend, but losing $60,000 could result in a deeper correction. Investors are watching these levels closely as they will determine the direction of Bitcoin’s next major move.
Featured image from Dall-E, chart from TradingView


