- February 10, 2026
- Posted by: admin
- Category: BitCoin, Blockchain, Cryptocurrency, Investments


The post Bitcoin Price Prediction 2026, 2027 – 2030: How High Will BTC Price Go? appeared first on Coinpedia Fintech News
Story Highlights
- Bitcoin is currently trading at: $ 68,589.05762744
- Predictions suggest BTC to hit $150K to $250K before 2026 ends.
- Long-term forecasts estimate BTC prices could hit $900K by 2030.
After a historic 2025 that saw Bitcoin shatter records and flip the legendary $125,000 mark, the market has taken a sharp, cooling turn. The early weeks of 2026 have been defined by a “sell-the-news” reality check, leaving many to wonder if the bull run has finally run out of steam or if we are simply witnessing the ultimate “buy the dip” opportunity.
The landscape has shifted. With a pro-crypto administration in the White House and institutional giants like MicroStrategy and Metaplanet treating BTC as a foundational reserve asset, the rules of the game have changed. No longer just a speculative play for retail traders, Bitcoin is now a geopolitical chess piece and a corporate balance sheet staple.
But as the price tests crucial support levels, the big question remains: Is this a temporary correction before a march toward $200,000, or the start of a long-term reset?
In this deep dive, we break down the Bitcoin price prediction for 2026–2030, exploring the massive trends, regulatory shifts, and institutional moves driving this historic cycle. If you want to know where the floor is and how high the ceiling goes. read on for the full scoop.
Coinpedia’s BTC Price Prediction 2026
In early 2026, Bitcoin is in a correction phase after peaking at around $126,296 in October 2025. A potential bottom may occur around December 2026, with significant support expected between $25,900 and $30,350. Historical trends suggest this decline could reach 70%-76%, potentially bringing Bitcoin down to the lower border of the ascending broadening wedge’s support. This period may mark the end of the bear market, with 426 days in total, similar to historical correction periods, and pave the way for a rally in the next year.
The BTC price may range between $68,291.03 and $71,076.80 today.
Table of Contents
- Story Highlights
- Coinpedia’s BTC Price Prediction 2026
- Bitcoin February Price Prediction 2026
- Bitcoin Price Prediction 2026
- BTC Price Indicator Analysis 2026
- Bitcoin Price On-chain Outlook
- Recent Events Affecting Bitcoin’s Price
- Bitcoin Crypto Price Prediction 2026 – 2030
- Bitcoin Prediction: Analysts and Influencers’ BTC Price Target
- FAQs
Bitcoin Price Today
| Cryptocurrency | Bitcoin |
| Token | BTC |
| Price | $68,589.0576 |
| Market Cap | $ 1,370,902,115,186.34 |
| 24h Volume | $ 46,265,629,687.6592 |
| Circulating Supply | 19,987,184.00 |
| Total Supply | 19,987,184.00 |
| All-Time High | $ 126,198.0696 on 06 October 2025 |
| All-Time Low | $ 0.0486 on 14 July 2010 |
Bitcoin February Price Prediction 2026
As of early February 2026, Bitcoin is trading near $ 70,000 after a sharp crash from the late January 90K area. In the immediate term, $60K support plays a key role in preventing BTC from falling further.
So far, several key levels have broken along the way, and that shift has traders watching for a clear short-term bottom before they start retaking bigger bets.
Overall, the Sentiment still feels shaky, leaning more toward the bearish side. The Crypto Fear and Greed Index still sits in Extreme Fear, and spot Bitcoin ETFs have continued to withdraw funds based on weekly flows data, September 2025 onwards. Major outflows occurred, even in early February.
Also, the 50-day EMA is technically below the 200-day EMA, so the death cross signal has remained alive since mid-November. The short-term EMA death cross between the 20-day and 50-day EMA bands occurred in late January, confirming the bearishness in the short term.
Therefore, Traders now treat $60,000-$65,000 as the next line of support. Lose it, and forced selling can follow. February has started choppy, and it stays that way until buyers return in size again. If they do, $74,750 stays target 1 for February, and $84,900 is the target 2 in the short term.
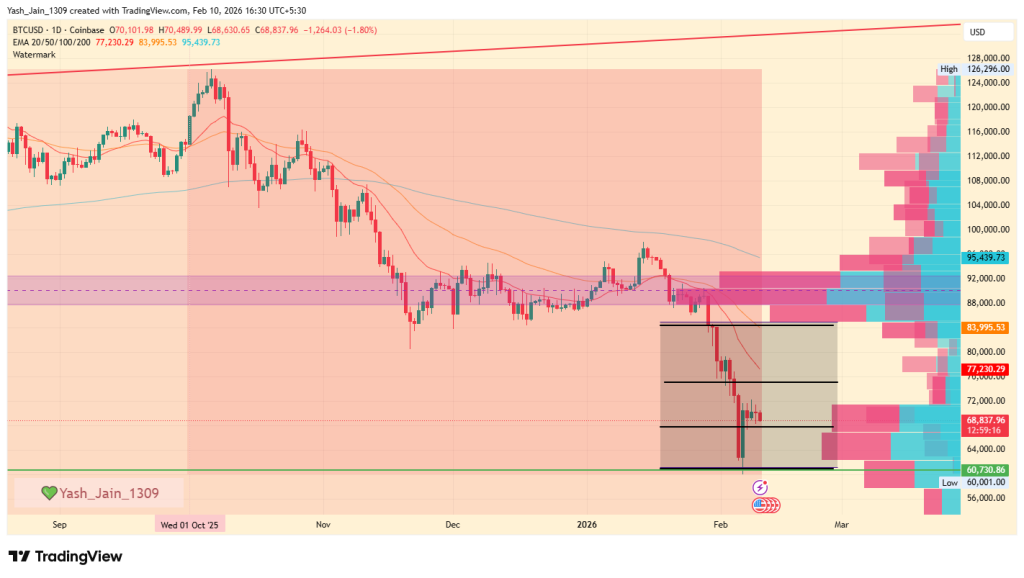
While the entire bearish structure remains dominant, a tilt towards the bullish structure, with the 200-day EMA band at $95,700 defeated, will be key. Till then, the overall structure remains on the bearish side.
Bitcoin Price Prediction 2026
The current price action in early 2026 confirms that Bitcoin price is following a well-defined historical rhythm within its long-term ascending wedge. After reaching a peak of approximately $126,296 in October 2025, the market has entered a significant correction phase.
This peak was not accidental; it represented a direct hit on the upper resistance boundary of the wedge pattern that has governed Bitcoin’s macro price action for years. Historically, these touches lead to extended periods of decline the first major crash from $21,000 lasted 427 days, while the second from $69,000 lasted 426 days. If this 14-month corrective cycle holds true, we are looking at a “target date” for a definitive bottom around December 2026.
The intensity of the sell-off in February 2026 was largely driven by a failure to reclaim the $87,800–$92,950 supply range. According to the anchored volume profile, this zone represented the highest momentum area of the previous bearish move, and once it flipped from support to resistance, the downward pressure has accelerated. Since markets don’t go straight, there will be attempts to rise, but the likelihood is high that they will occur in the future as fakeouts and result in further decline.
As we look toward the remainder of 2026, the charts suggest that the most significant high-momentum demand area sits much lower, specifically between $25,900 and $30,350.
This range represents a crucial “interest zone” where institutional buyers previously stepped in and where the lower support of the ascending wedge is likely to converge by year-end.
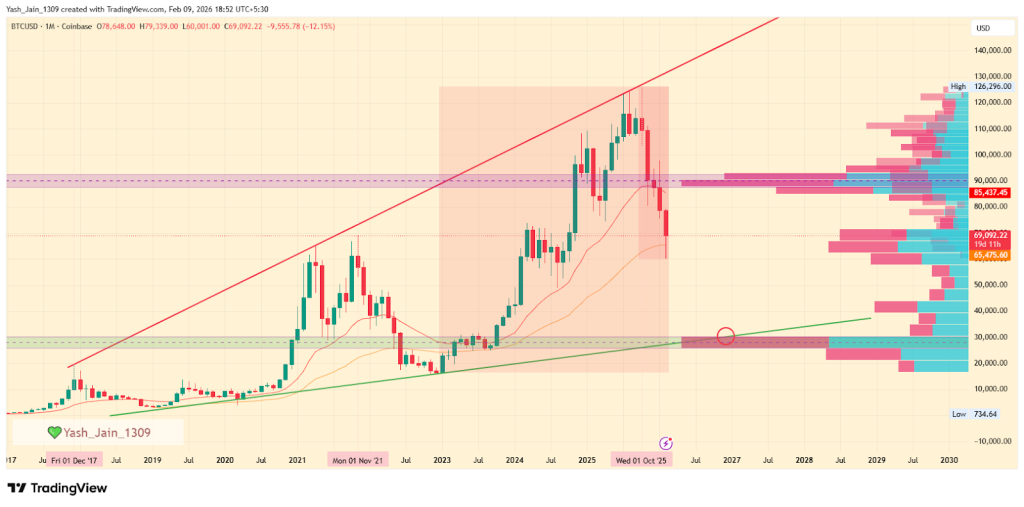
Statistically, Bitcoin’s major crashes have shown a trend of diminishing returns in terms of percentage drawdowns. The late 2017 onwards crash saw an 87.25% decline, and the 2022 crash reached 78.65%. Following this trajectory of “dampening volatility,” the current third crash is projected to result in a 70%-76% approx decline. From the $126,000 ATH, a 76% correction would push the price toward that critical $30,000 region.
Consequently, the prediction for December 2026 is a final test of the wedge’s lower border within this demand zone, marking the end of the current bear cycle and setting the stage for the next period of accumulation and next big rally could occur in 2027 onwards.
BTC Price Indicator Analysis 2026
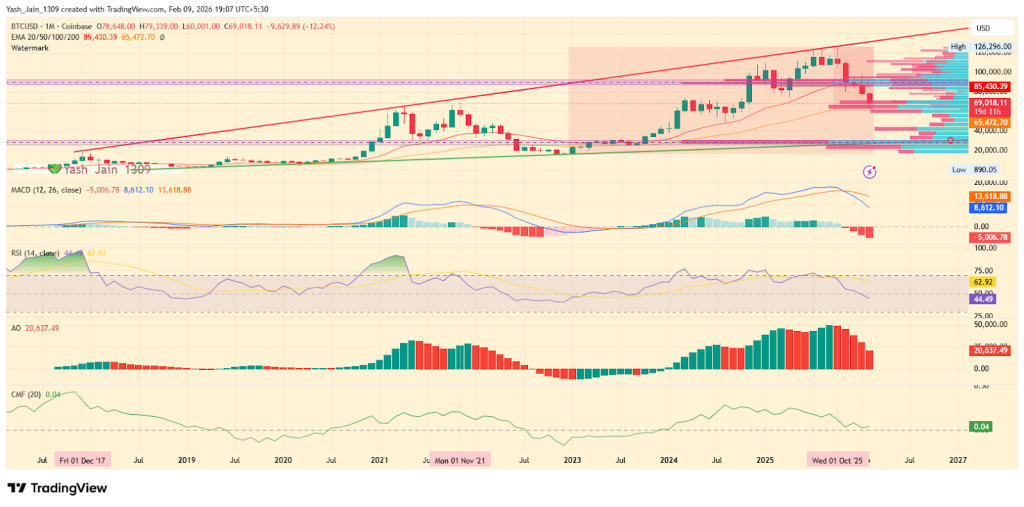
Similarly, the technical indicators shows that Bitcoin price has already entered a danger zone we haven’t seen in years. On a deeper look at the monthly RSI, BTC has a legendary track record of never hitting “oversold” levels; it usually bottoms out right around the 40 mark. Right now, we’re sitting at 44.49 and sliding fast. This isn’t just a dip it’s the classic signal that the bearish momentum is finally taking over and heading for that historical floor.
The indicators under the hood are screaming the same thing. The MACD has already locked in a bearish cross, and the gap between the lines is widening. In past crashes, the selling hasn’t stopped until those lines flattened out near the zero mark. We aren’t even close to that “exhaustion” point yet, meaning there is plenty of room for this to bleed out further.
Even the “smart money” indicator (CMF) is still showing positive inflows for now, but that’s actually the scary part. Once that green line snaps below zero and heads toward -0.20, that’s when the real panic hits. We aren’t at the end of the crash; we’re in the middle of it. Don’t mistake this for exhaustion, as the collapse toward the pattern’s lower border would soon intensify.
| Month | Potential Low | Potential Average | Potential High |
| 2026 | $30,000-$45,000 | $90,000 – $101,000 | $115,000 – $118,000 |
Bitcoin Price On-chain Outlook
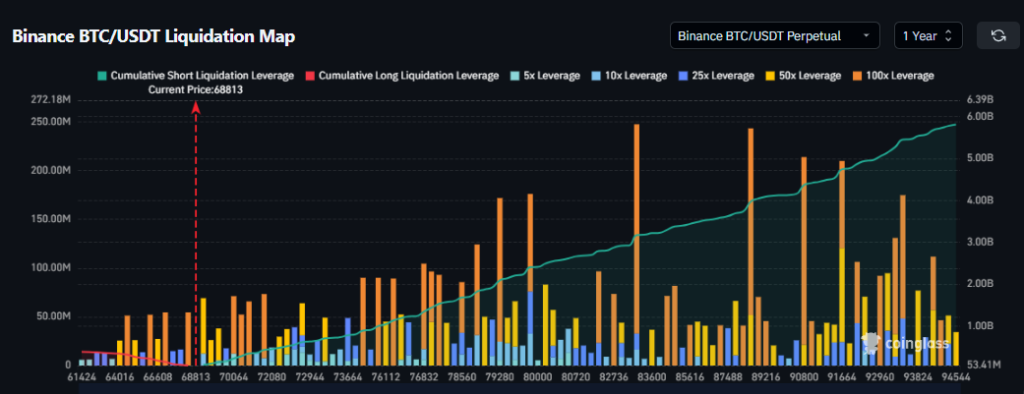
Liquidation data shows roughly $5.81 billion on the short side, compared with just over $380 million on the long side. That imbalance matters because it’s completely dominated by bears and bulls, with no room for survival. It suggests traders are leaning into weakness rather than preparing for a sustained rebound.
In other words, the futures market isn’t buying the bounce. It’s betting against it.
And if BTC price drifts lower again, that heavy short positioning could amplify volatility rather than cushion it. This is why any BTC price prediction right now carries asymmetric risk.
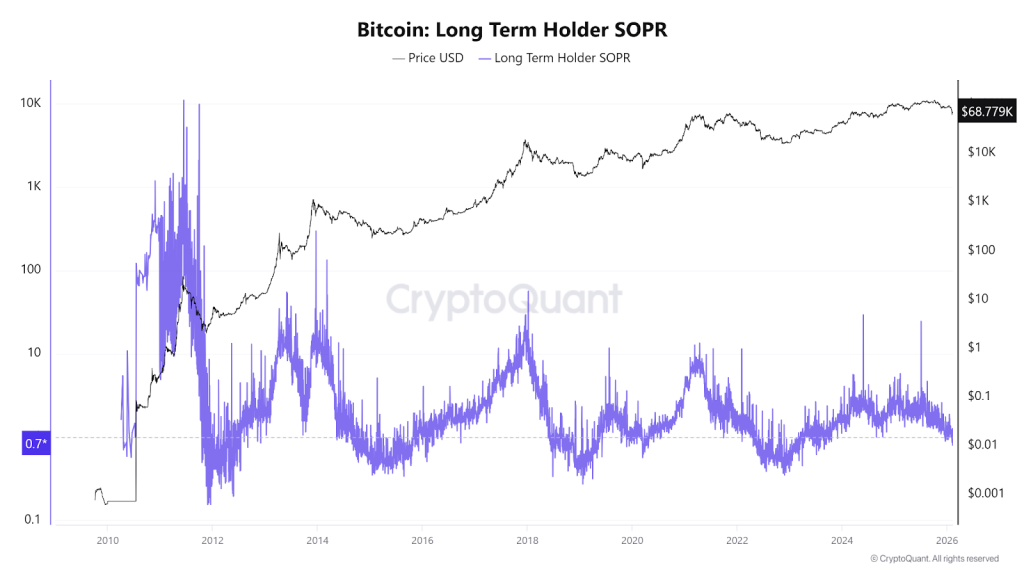
Moreover, the BTC long-term holder SOPR chart shows a current value of 0.7, which is below 1, indicating that more long-term investors are selling at a loss. And it’s seen when more holders keep selling at a loss, this metric has a history of hitting the 0.2-0.3 mark, which has truly seen a fresh demand. For now, the long-term trend is more bearish.
Recent Events Affecting Bitcoin’s Price
- The transition from late 2025 into early 2026 saw Bitcoin flip from a booming success story into a struggling “bear market.” After hitting its peak in October, the excitement cooled off fast as the fundamental pillars holding up the price began to crumble at the same time.
- By December, the “cheap money” era felt officially over. The Federal Reserve confirmed that high interest rates weren’t going anywhere, and the nomination of Kevin Warsh to replace Jerome Powell signaled a shift toward even tighter financial discipline. This left investors spooked, fearing a future without the safety net of central bank support.
- The situation worsened in January when big institutional players started pulling their money out of spot ETFs to lock in profits. At the same time, rising tensions between the U.S. and Iran proved that Bitcoin isn’t yet seen as a “safe haven” but investors ditched crypto for actual gold to avoid the risk.
- Finally, a “double blow” of bad news drained what was left of the market’s momentum. Crucial crypto legislation, the CLARITY Act, got stuck in the Senate, leaving the industry in legal limbo. Meanwhile, new fears about quantum computing threats to blockchain security started to circulate. Together, these events broke the market’s confidence, pushing the price toward the lower end of its long-term trend.
Bitcoin Crypto Price Prediction 2026 – 2030
| Year | Potential Low ($) | Potential Average ($) | Potential High ($) |
| BTC Price Forecast 2026 | 150K | 200K | 230K |
| BTC Price Prediction 2027 | 170K | 250K | 330K |
| Bitcoin Predictions 2028 | 200K | 350K | 450K |
| BTC Price 2029 | 275K | 500K | 640K |
| Bitcoin Price Prediction 2030 | 380K | 750K | 900K |
BTC Price Forecast 2026
The BTC price range in 2026 is expected to be between $150K and $230K.
BTC Price Prediction 2027
Subsequently, the Bitcoin price range can be between $170K to $330K during the year 2027.
Bitcoin Predictions 2028
With the next Bitcoin halving, the price will see another bullish spark in 2028. Specifically, as per our Bitcoin Price Prediction, the potential BTC price range in 2028 is $200K to $450K.
BTC Price 2029
Thereafter, the BTC price for the year 2029 could range between $275K and $640K.
Bitcoin Price Prediction 2030
Finally, in 2030, the price of Bitcoin is predicted to maintain a positive trend. Indeed, the BTC price is expected to reach a new all-time high, ranging between $380K and $900K.
Bitcoin Price Prediction 2031, 2032, 2033, 2040, 2050
Based on the historic market sentiments and trend analysis of the largest cryptocurrency by market capitalization, here are the possible Bitcoin price targets for the longer time frames.
| Year | Potential Low ($) | Potential Average ($) | Potential High ($) |
| 2031 | $540,830.43 | $901,383.47 | $1,261,936.86 |
| 2032 | $757,162.60 | $1,261,936.86 | $1,766,711.60 |
| 2033 | $1,059,945.80 | $1,766,711.60 | $2,473,477.75 |
| 2040 | $5,799,454.28 | $9,665,757.13 | $13,532,059.98 |
| 2050 | $161,978,188.65 | $269,963,647.74 | $377,949,106.84 |
Bitcoin Prediction: Analysts and Influencers’ BTC Price Target
“Jack Dorsey, former Twitter CEO (now X), predicts Bitcoin could exceed $1 million by 2030 due to its ecosystem growth and increasing adoption.”
Cathie Wood, CEO of Ark Invest, projects Bitcoin to reach $1.5 million by 2030, driven by institutional adoption and its position as digital gold.”
“Wall Street broker Bernstein believes 2026 will mark the start of a tokenization “supercycle,” maintaining its $150,000 Bitcoin price target for this year and $200,000 for the 2027 cycle peak.”
“Brad Garlinghouse, the Ripple CEO, predicts Bitcoin will hit $180,000 in 2026, due to favorable market and regulatory conditions.”
Never Miss a Beat in the Crypto World!
Stay ahead with breaking news, expert analysis, and real-time updates on the latest trends in Bitcoin, altcoins, DeFi, NFTs, and more.
FAQs
Major risks include global recessions, tighter crypto regulations, declining liquidity, or a sustained breakdown below key support levels.
Bitcoin price forecasts for 2030 range from $380K to $900K, driven by scarcity, long-term adoption, and expanding institutional participation.
While uncertain, many long-term projections suggest Bitcoin could exceed $1 million by 2050 if it becomes a global store of value.
Bitcoin’s fixed supply makes it attractive as an inflation hedge, especially during currency debasement and long-term economic uncertainty.


